Subscribe to our newsletter!
Would you like to receive regular tips and news about donor recruitment and retention?
Subscribe to our newsletter now!

By James Herlihy, Senior Digital Consultant, Mindwize
Universal Analytics – which most nonprofits are still using – will stop processing data on 1 July, 2023. At that point, only Google Analytics 4 (GA4) will continue to process new user behaviour data.
On 1st July, 2023, Google’s Universal Analytics – the version of Google Analytics that most nonprofit websites still use – will stop processing data. From that point on, only organisations that have installed the newer version, Google Analytics 4 (GA4), on their website and apps will continue to receive Google Analytics user behaviour data.
GA4 isn’t just a small update to Universal Analytics. It’s a new paradigm and way of thinking that’s not necessarily intuitive to even experienced Universal Analytics users.
As such, while it’s designed to improve our understanding of customer behaviour, in the short-term the forced shift to GA4 is a disruptor to both (a) immediate users of Google Analytics and (b) people “up the line” who rely on the analytics and insights derived from it; including fundraisers and nonprofit managers.
So today, we unpack some of the key features and updates in GA4, their relevance for fundraisers, and four things you should do to get ahead of this major change.
Want help with your Google Analytics migration or deriving better analytics insights? Get in touch with Mindwize now.
If you’ve used Google Analytics for years, you might expect to be able to open GA4 and make sense of it. How hard can it be, right?
Actually, GA4 is fundamentally different to previous versions in a number of ways that will make it harder for a lot of people to pick up and use without some training. Below we uncover some of those key features and how they’re relevant to fundraisers and nonprofit professionals.
While there are familiar elements throughout the GA4 interface, the structure of reports has fundamentally changed. The main menu has evolved from the Universal Analytics structure on the left below to the simplified GA4 format in the middle.
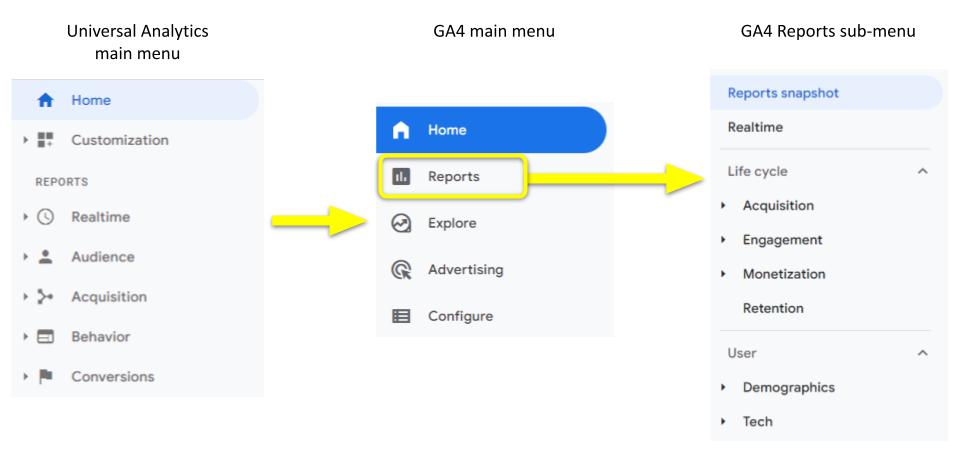
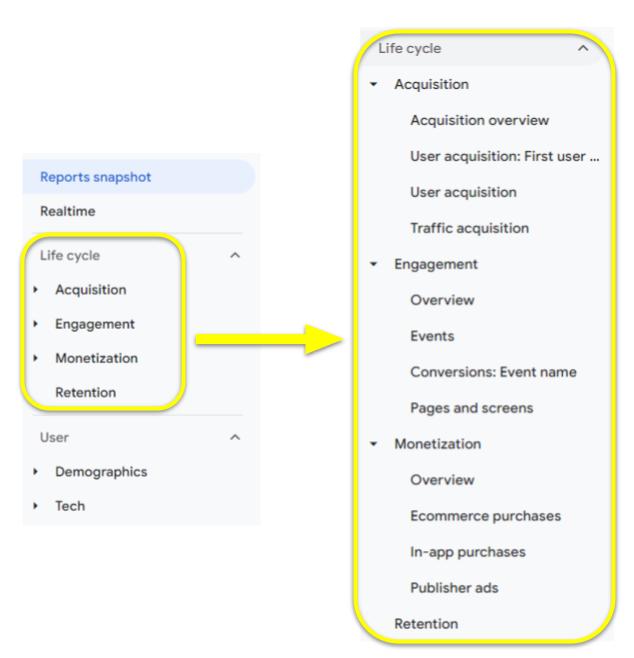
In GA4, Reports expands into a sub-menu that focuses on the customer (or for non-profits, supporter) life-cycle and user information. Three of the four life cycle stages – Acquisition, Engagement, Monetisation and Retention – then expand further into a number of further sub-reports.
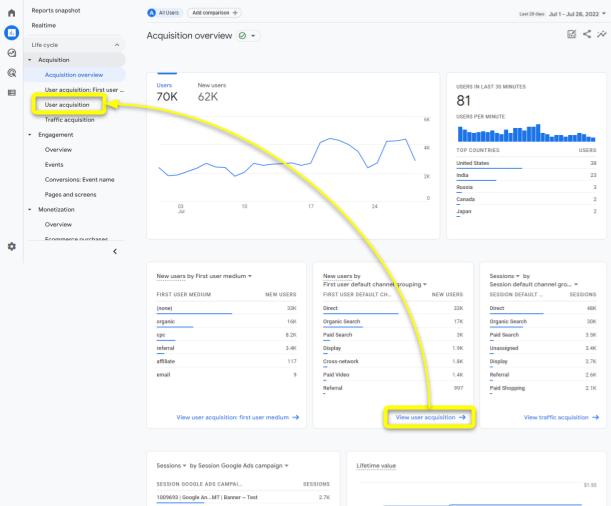
The Overview report of each stage includes a limited number of summary cards presenting top-level metrics that answer common business questions about user behaviour. You can click on some of these widgets to jump to a more detailed report page on that specific metric. So for example in the Acquisition overview report below, you can click on the View user acquisition link to jump to that report page.
Google has drastically consolidated the number of default report pages. In doing this, it feels like they’re trying to simplify access to the basic reports that the majority of users are looking for. If you want to dig deeper with your analysis, you can set up custom reports or dive into the Explore section, which we review below.
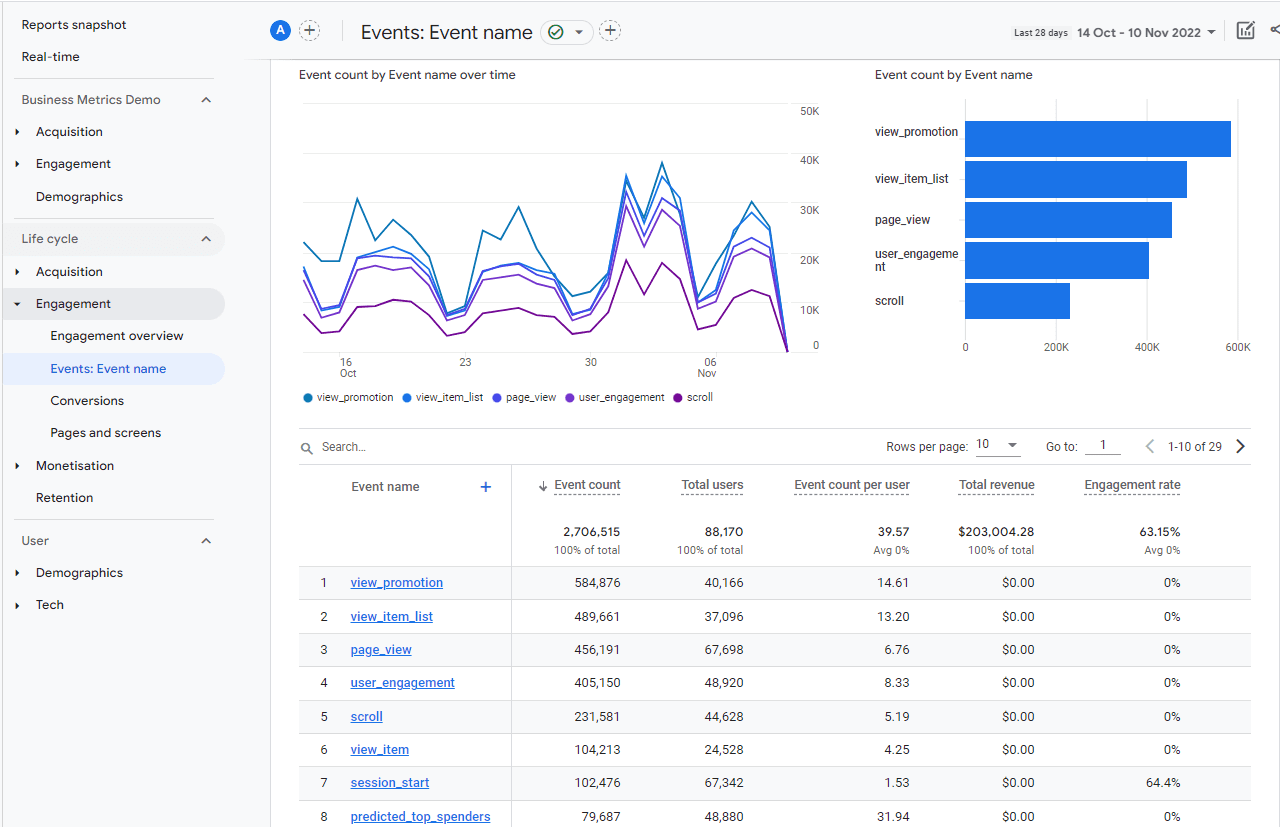
The terminology and metrics in GA4 reports has also evolved a lot from Universal Analytics, focusing more on events (unpacked more below), engagement and user metrics and less on “volume metrics” like page views. For example an engaged session is a session that lasts 10 seconds or longer, or includes at least one conversion event or more than one page view. Engaged sessions is prominent in the Engagement Overview report, and is used to calculate other metrics like engagement rate.
Overall in terms of structure and metrics, it seems that Google is trying to push organisations to:
Fundraisers are no strangers to life-cycle thinking. Strategising journeys from prospecting/engagement to donor acquisition and retention is our bread and butter. But some fundraisers need to evolve their supporter relationship thinking from a direct mail cycle paradigm to the modern, digital paradigm.
So for example, rather than looking at donor conversion as the point at which a meaningful relationship starts, we can follow Google’s perspective on the first touchpoint as the moment a (non-financial) “supporter” is acquired. Following this, GA4’s life-cycle stages can be translated as follows to nonprofit supporter life-cycle stages:
| GA4 life-cycle stage | Supporter life-cycle stage |
| Acquisition | Lead generation or online community growth (including first website visit, social media interaction/follow etc) |
| Engagement | Supporter engagement |
| Monetisation | Donor conversion |
| Retention | Donor retention |
If you want to delve deeper than the simplified Reports section, you can start an exploration in GA4’s new Explore section.
According to Google, an exploration is an “advanced technique that goes beyond standard reports to help you uncover deeper insights about your customers’ behavior”. Explorations allow you to take your analysis beyond the level of standard reports, digging deeper and more flexibly into the data.
Google provides six exploration templates along with a Free form from which you can start a new, blank slate exploration from scratch.
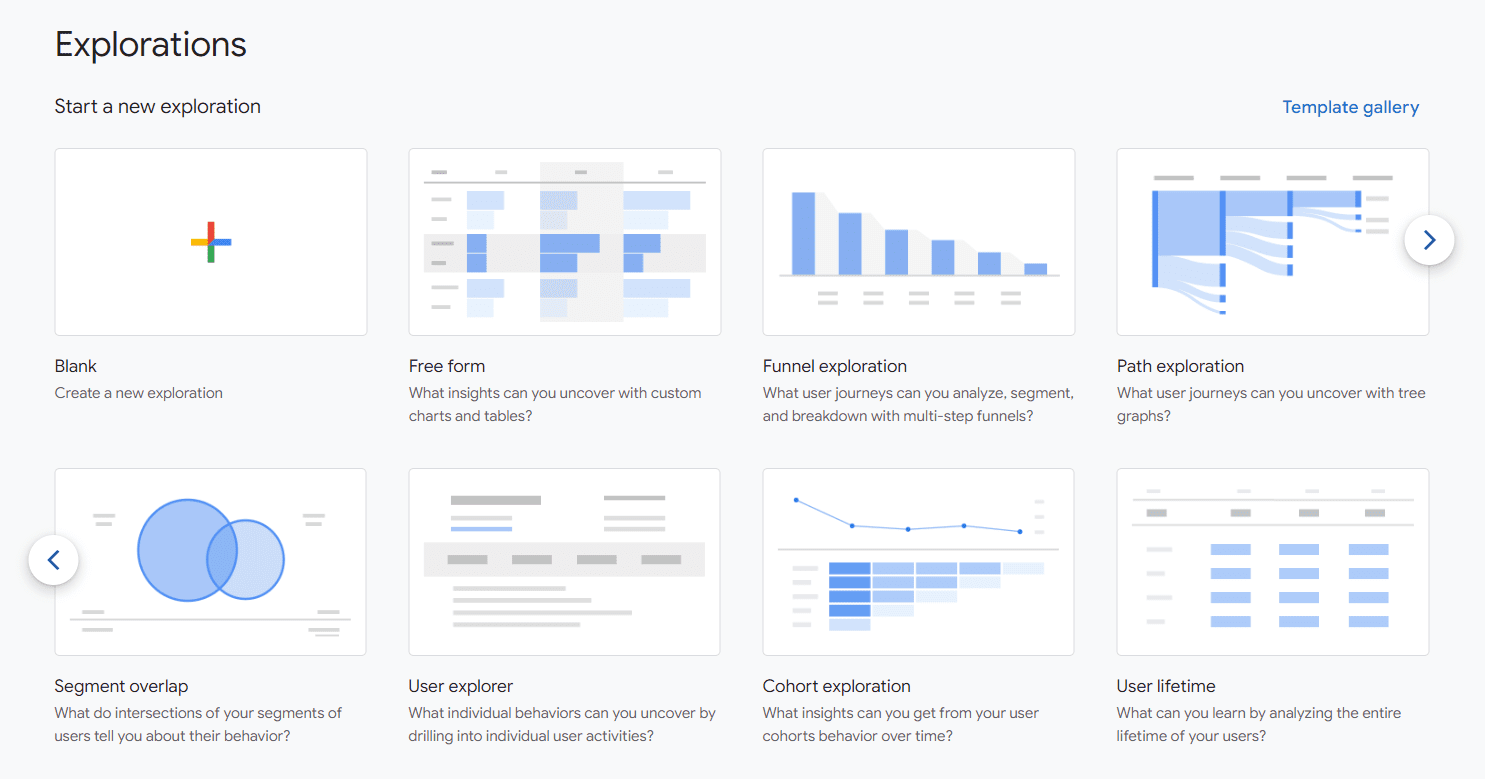
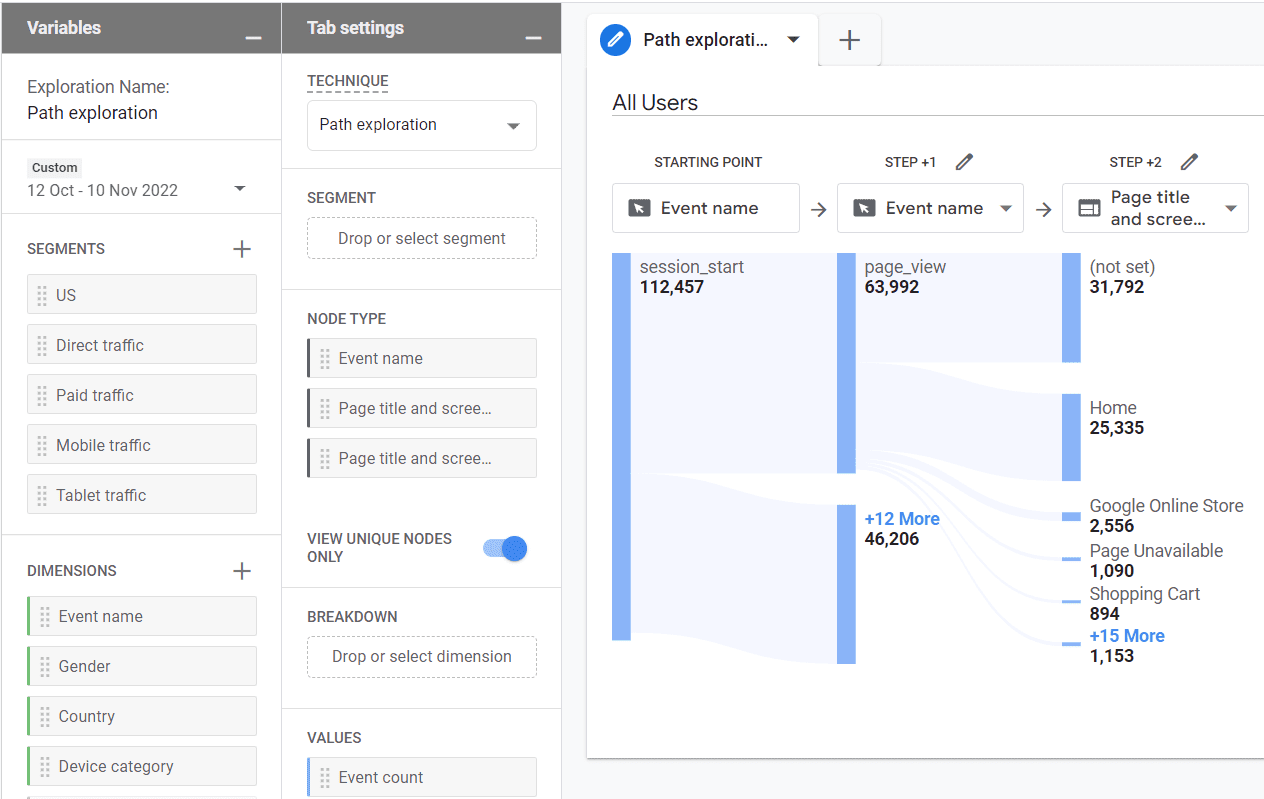
Most templates are evolved versions of Universal Analytics reports. For example the path exploration borrows from the Universal Analytics Behavior Flow report, but features nicer interactivity and allows you to cut the data flexibly with metrics, dimensions, user segments and other settings.
Explorations are prominent and take up a fair bit of real estate in the GA4 property. Again it seems like Google is trying to raise the general level of user behaviour analysis. It’s a challenge to Google Analytics users to up our collective game.
Mastering these reports certainly will up the game of fundraisers who can get their heads around them. If you want to master digital marketing, the concepts in the six reports above are a great foundation.
One of the biggest components of the Google Analytics paradigm shift is the data model. Whereas Universal Analytics uses a session-based model that groups user interactions, GA4 is based on standalone events.
Events aren’t a new concept in GA. Experienced users will know that configurable events have been a part of Universal Analytics for years. They can be thought of as interactions that the user has with your website, or milestones they reach in your funnels, like clicking on a specific button (for example “submit my donation”) or reaching a certain part of a form.
The difference is that in GA4, Google has shifted to all interactions being classed as events. The platform can track certain interactions by default – page views, scrolls, outbound clicks, site search, video engagement and file downloads. And then with some further setup, you can track any other interaction you want as an event.
Want help with your Google Analytics events configuration? Get in touch with Mindwize now.
Another major shift in GA4 is its consolidation of customer behaviour into a single view across all an organisation’s platforms and devices. This is huge for companies that run Android and iOS apps next to websites, as customers nowadays have complex cross-device behaviours; for example many of us do piecemeal research on one or two devices over several weeks or more before making a purchase on a third device.
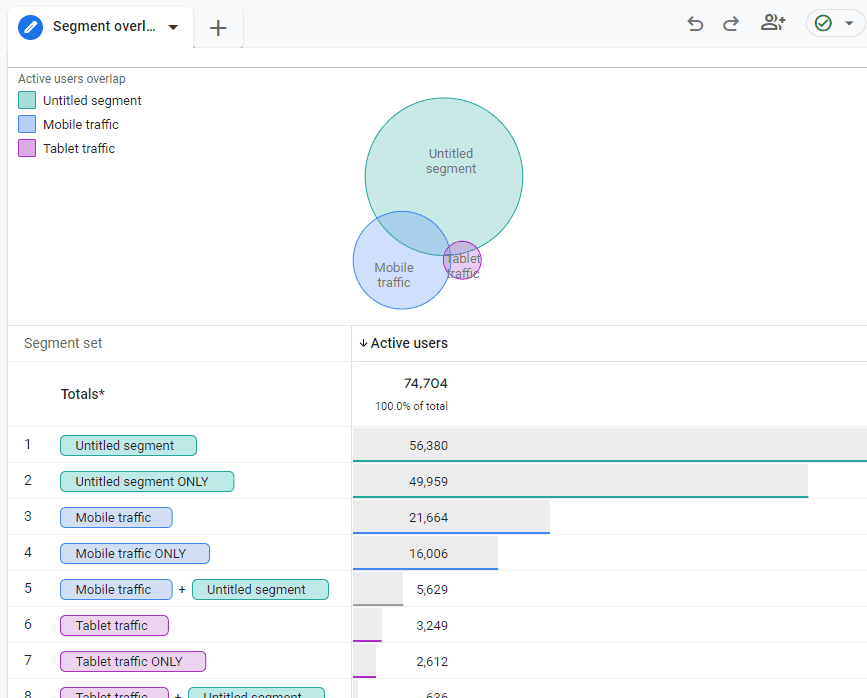
Of course it’s less relevant to the majority of nonprofits that have just a single website and no mobile apps or other properties. But even in this case, GA4 may still provide more accurate intelligence on how your supporters use your website across multiple devices, like in the segment overlay exploration below.
To achieve this cross-platform view, Google uses a hierarchy of identity spaces including website/app user IDs, Google signals (data from people signed into Google) and device IDs.
The proportion of total donations made online nowadays is significant for most charities. A stronger understanding of how donors and prospects are using your website (and apps if they’ve got them) across different devices better positions you to optimise user journeys and cross-device funnels for conversion.
Analytics Intelligence is a “set of features that uses machine learning and conditions you configure to help you understand and act on your data”. It uncovers insights, which are intended to help you find anomalies, trends, trend changes and predictions that flag opportunities or issues for further analysis. Insights can be automatically derived by Google, or custom defined by you.
While Analytics Intelligence and insights are also features of Universal Analytics, it feels like they’re being brought more to the fore. In GA4 they have their own dashboard, linked from the Home page, and are gradually being made more prominent across the platform.
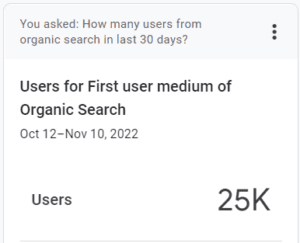
Google is also promoting more the use of the search bar to pose human language questions. For example, “how did organic search traffic last week compare to the week before?” yields a straightforward answer:
GA4 requires a minimum volume of data sent through the platform to start producing insights, and will produce more the more data it has. So don’t expect it to start producing insights from day 1 – it’ll take some time, especially if you’ve got a lower volume website.
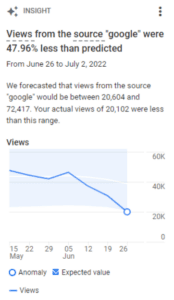
To be honest, in our client accounts at Mindwize and my further research, I’m yet to see Google provide “insights” deeper than what a simple glance at the data would tell you. Taking the example below, we could see from a standard traffic source report that views from the source “google” dropped significantly towards the end of the reporting period. The fact that it’s slightly lower than the lower end of Google’s prediction range doesn’t tell us anything really, unless we really dug into how it derived that range.
To be fair, the insight does flag something that’s worth looking into, namely “why is our organic traffic dropping so much?” But you or your digital team should be looking at traffic source reports regularly and spotting these clearly visible trends – it’s not a complex or hidden metric.
However, while the jury is out on the current utility of automated analytics insights, they should become more useful as the system gathers more data and it sees what you interact with and report on. Artificial intelligence is the way of the future; its output will increase in utility and value as it learns and becomes more sophisticated.
GA4 includes even more features than the five areas listed above. But if most of the above is new to you, that’s enough for now!
Want help with setting up Google Analytics 4 on your website or app? Get in touch with Mindwize now.
What you need now isn’t more information, but a list of next steps you need to take to start using GA4. Here’s that list:
If there’s one thing you do, install GA code on your website asap. With less than a year to go before Universal Analytics stops processing data, today is the right time to action this.
GA4 and Universal Analytics are not mutually exclusive. You can have them both running side-by-side. In fact it’s preferable to have a period of overlap during which you still have the familiar Universal Analytics reports to fall back on while learning the GA4 reports.
For how to do this, read Google’s instructions or find a good video on Youtube, like this one.
Once you’ve got it installed, do these two things each week:
Spend the time in these two areas regularly and you’ll steadily build your mastery.
There are tons of good learning resources, informative articles and videos out there. Google promotes the Skillshop courses on GA4, but there are more out there to suit every learning style.
Events are super important in GA4. GA4 tracks six types of events by default, but you’ll want to go further than that if you want to maximise insights you can use to optimise your results.
Working with a colleague or two, map out the primary business objectives of your website, then the user tasks that deliver on those objectives, then identify all of the small decisions and steps a user takes in the journeys to completing those tasks. That’s a good start for a list of tailored event candidates.
You might want support from an expert who can advise on best practice event configuration and guide you based on experience. Reach out to Mindwize if so.
You may want to review your old website analytics reports or run queries on your Universal Analytics data at some time in the future. You can export Universal Analytics data and reports to ensure you have access to them into the future. This is a good idea.
This video from Loves Data explains how to do this via common Universal Analytics report export methods or the Google Sheet plugin. If your technical data skills are more advanced, you can also export your data to BigQuery, as explained in this video from Google.
Side note: Unfortunately, you can’t import your Universal Analytics data to GA4 as the two systems are based on different data models.
———
Google Analytics 4 isn’t coming. It’s here, now. If you haven’t started using it, you need to do so, or choose another analytics program to migrate to very soon.
While the paradigm shift entails a steep learning curve for some, there are benefits. GA4 is designed to deliver more actionable insight on how your supporters interact with your digital properties, which should allow you to optimise your fundraising and engagement results. Google also seems to be promoting more strategic ways of thinking about the supporter life-cycle and supporter journeys.
If you haven’t already, take action today to get GA4 code installed across your website. If you need support from an agency that understands GA4, digital channels and the needs of nonprofits, reach out to Mindwize today.

Today, you watch a video on Facebook about animal suffering. Tomorrow, you’ll see an ad for an animal rights charity to sign a petition, download a brochure or take a quiz – something the organization can use to get your contact details. In this way, you have become a lead. The charity can contact you with a request, an offer or a service.
Would you like to receive regular tips and news about donor recruitment and retention?
Subscribe to our newsletter now!