Are you getting digital engagement insights to the people who need them the most?
Digital channels in 2022 offer fundraisers dizzying amounts of data about our audiences, their behaviour and preferences. From website analytics to social ad platforms to email programs and more, we’ve got almost limitless opportunity to collect valuable data and turn it into actionable insight.
There’s just one problem…
This huge amount of rich data and potential also brings complexity and barriers to entry. It requires specialised digital literacy to access and understand data across the various digital platforms an organisation may use, let alone turn it into actionable insights.
This can effectively lock out decision-makers; particularly those with the broadest experience who could offer the most valuable strategic direction based on that data.
Luckily, there’s a solution …
Enter the tailored online dashboard
Data visualisation software like Google Data Studio, Power BI and Tableau (matched with intelligent, informed dashboard design!) can bridge the gap between your complex digital platform analytics and the business needs of decision-makers.
| “ Data that before I couldn’t access directly was all of a sudden at my fingertips. The information helps Intact America to better understand our audiences – who they are, how they respond to different content, and how and what different channels contribute to our program. This richer understanding will help us make better decisions and to achieve greater impact for our cause.
|
|
| – Georganne Chapin, Founding Executive Director, Intact America |
While such software has been around for decades now, its ease-of-use and integration with common digital marketing platforms have improved dramatically in recent years. This has transformed online dashboards from luxury gear that only well-resourced organisations could afford to tools available to all; and ones that are increasingly required to remain competitive.
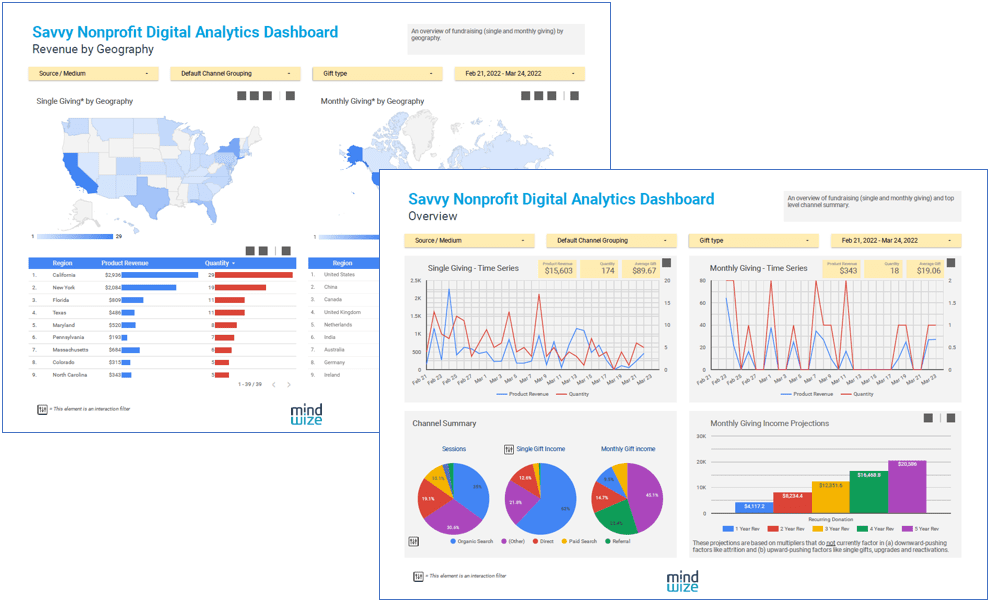
Online dashboards must be planned with a strong understanding of the end audience, of business needs and based on an understanding of user interaction (UI) design. They also need to be built with a firm understanding of the platforms that are acting as data source, their metrics and characteristics. And of course an eye to detail and quality control.
With these requirements met, you can facilitate better decision-making at all levels – from content producers wanting to optimise their social posts to senior managers making investment decisions for long-term strategic plans.
Georganne Chapin, Founding Executive Director at Intact America, said “When Mindwize presented Intact America’s new online reporting dashboards, I was delighted. Data that before I couldn’t access directly was all of a sudden at my fingertips. The information helps Intact America to better understand our audiences – who they are, how they respond to different content, and how and what different channels contribute to our program. This richer understanding will help us to make better decisions and to achieve greater impact for our cause.”
Want to take your data-driven decision making to the next level?
At Mindwize, we’ve helped non-profits around the world with data management, insights and fundraising program development for over 20 years. We love to leverage our experience to help our clients make better, data-driven decisions and grow their fundraising programs.
Leave us your details and we’ll get in touch for an obligation-free call to discuss your needs. We’d love to hear from you!
More fundraising blogs
Subscribe to our newsletter
Get fresh insights to help your charity grow.